Volume Indicators
What is volume in trading? How do you use volume indicators to read the charts and gain a better understanding?
What is volume?
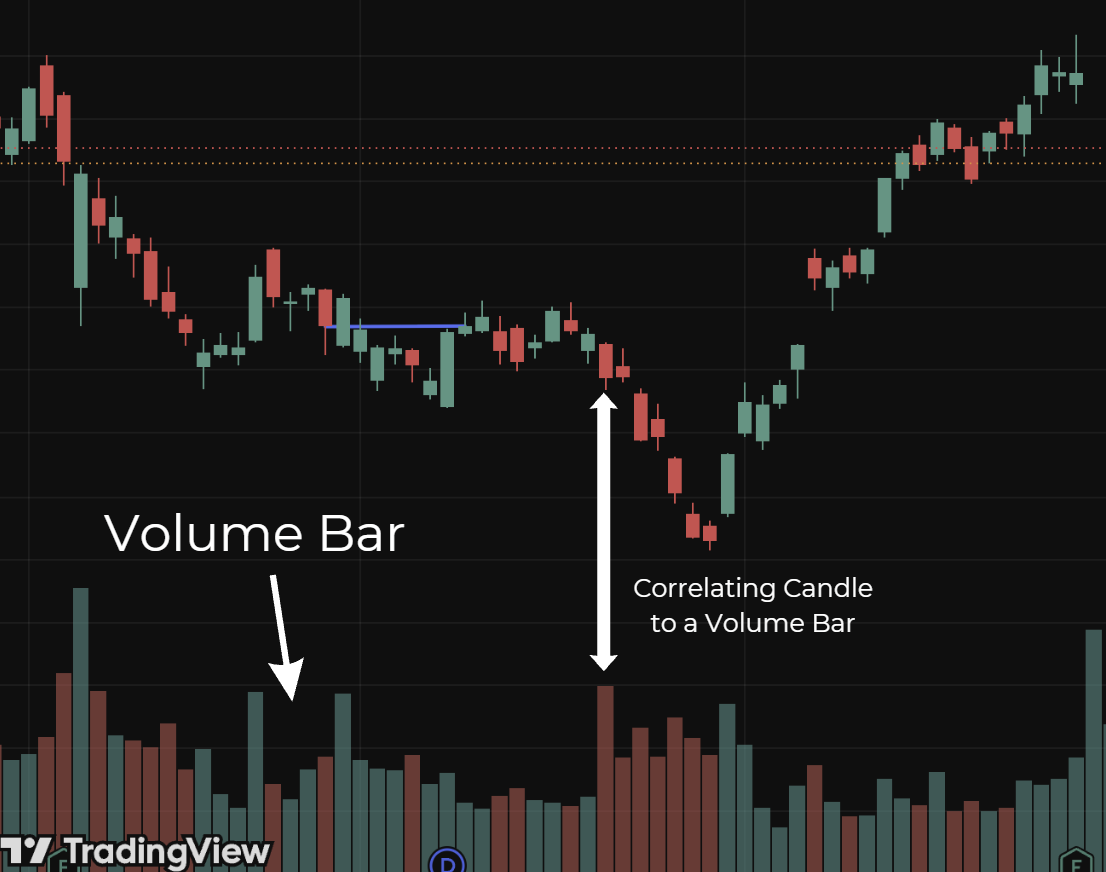
Volume is the number of assets traded during a specific period. On a chart, the volume indicator is depicted as bars at the bottom of the screen. It represents a number of how many shares were traded in the set period.
For example, let's look at a Type A Google share (GOOGL) chart down below. The chart is set at 1 day candles, meaning that each volume bar is recorded at the market open, and complete when the market closes. A common misunderstanding is the color of the volume bar only represent whether the opening price was higher or lower than the closing price, it does not reflect positive or negative volume.
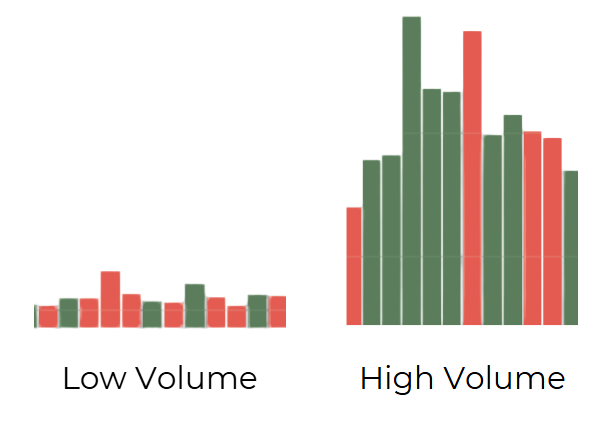
What does it mean to have high or low volume? High volume not only depicts active trading with many buyers and sellers, but also a strong interest in a stock with high liquidity (ability to turn assets into cash). Low volume depicted with short bars illustrates inactive trading: less market interest, and less liquidity.
Volume Price Relationship
How does volume relate to price? To answer this question, we can look at the volume price relationship.
We can first look at the color of the volume bar. If it is green, then the price of the stock is higher at the end of the period than the start, depicting a buying interest. Contrastly, a lower price at the end of the period results in a red volume, representing selling interest. Volume bars can represent how many people support this action. If the bar is red with a low volume bar, that emphasizes that not a lot of people are in on the bearish behavior.
For example if you have two identical candles, one with a volume of 10 and the other with a volume of 10,000, which of these candles show a more important/bullish behavior? More volume depicts more supporters, meaning that the higher volume represents more interest and therefore higher significance.
Volume Trading Strategy
Finally we can use a volume indicator in our actual trading strategy.
During uptrends, we would like to see a high volume that supports the upwards trend. If there is high volume, the price will more likely increase even more. We can continue this logic to downtrends. Large red candles might be worrisome, however if it has less volume, the trend might not be fully established.
In general, volume represents buying pressure. If buying pressure is high, the market will likely continue in the upwards or downwards trend. Keep in mind that volume cannot predict the market, but it provides some insight on the market health that can help you analyze the trends.