Support and Resistance
Learn how to identify the invisible floors and ceilings that control stock price movements.
What are Support and Resistance Levels?
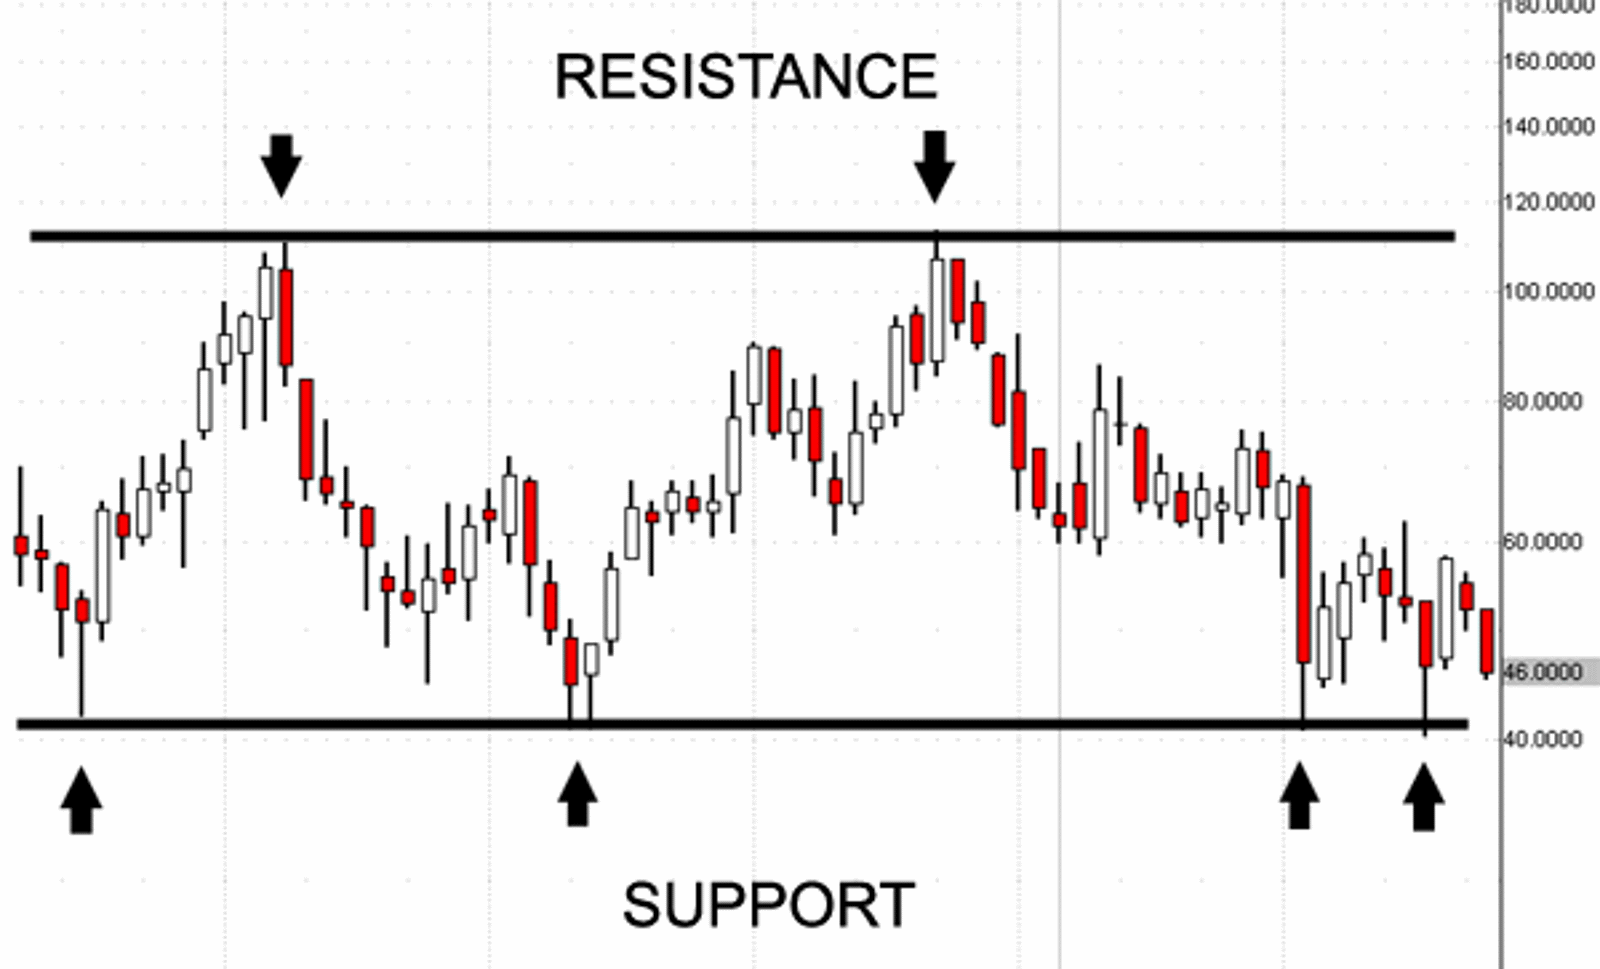
Support is an area where the price tends to stop falling and move back up. You can think of it like a floor. Buyers often become more interested around this area, which can push the price higher.
Resistance is the opposite. It is an area where the price tends to stop rising and fall back down. It acts more like a ceiling, where selling pressure starts to increase.
These levels are usually better treated as zones instead of exact lines. A stock might move slightly above resistance or below support before reversing, so the price does not have to react at one exact number.
How do you use them in a trade?
In simple terms, traders draw these lines to predict where the price might go next. If a stock is getting close to a strong support line, a trader might buy it, hoping it bounces up again. If it gets near resistance, they might sell before it falls.
Support and resistance can also break. When resistance is broken, it can sometimes become new support. When support breaks, it can become new resistance.
This is why traders usually do not rely on support and resistance alone. They may also look at things like volume, candlestick movement, and the overall trend before making a decision.