Moving Averages: Part 1
Understand how to smooth out messy daily stock charts to easily spot the main trend.
What is a moving average?
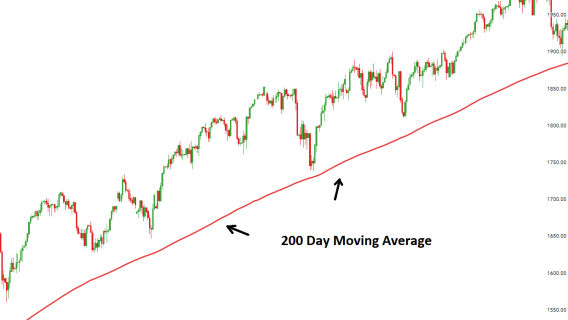
A stock chart can look incredibly messy and chaotic because prices jump up and down wildly every single day based on news and emotions. A moving average completely smooths out all this daily noise by taking the closing prices over a specific number of days, averaging them out, and drawing a single, flowing line directly over the chart. By looking at whether this smoothed-out line is pointing up or pointing down, investors can see the true, underlying direction the stock is heading without getting distracted by daily volatility.
What happens when different moving averages cross?
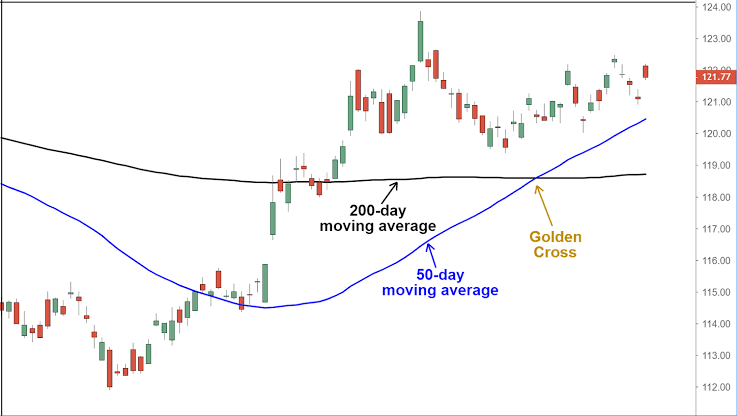
Traders monitor what happens when a fast-moving average (like the 50-day line) crosses over a slow one (like the 200-day line). When the 50-day crosses above the 200-day, it is called a "Golden Cross" and signals strong upward momentum. If it crosses below, it is a "Death Cross" warning of a downward trend.